Prediction From Goldman Sachs Suggests Precious Metal Can Surge to $5,000
Gold price moves past $4,000/oz with 52% YTD gains as central banks buy 1,000+ tonnes and Western ETFs see record $64B inflows.
Goldman Sachs forecasts gold reaching $4,900 by Dec 2026 while analysts cite dollar weakness, Fed rate cuts, and safe-haven demand.
Central bank diversification from US Treasuries and geopolitical tensions drive the gold rally, with most forecasts predicting $5,000+.
The price of gold breached the $4,000-per-ounce threshold for the first time this week, marking another stunning milestone in a three-year rally that has demolished analytical models and converted longtime skeptics.
The precious metal closed at $4,042.03 after hitting an intraday peak of $4,059.31, extending gains that have made it one of 2025’s best-performing assets with a 52% year-to-date surge.
The rally accelerated as the U.S. government shutdown entered its seventh day, delaying critical economic data releases and amplifying uncertainty across financial markets. Spot gold has now climbed more than 50% since January while the dollar index dropped 10%, creating conditions that independent metals trader Tai Wong says could push prices toward $5,000.
Why Gold Price Is Going Up?
Western Money Floods Back Into Gold
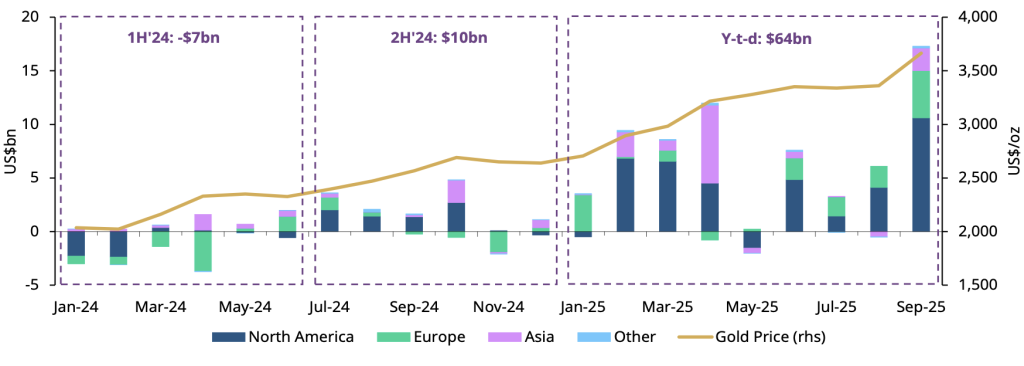
Western investors poured $64 billion into gold ETFs through September, with the month alone recording a record $17.3 billion, nearly double the previous monthly high set during the 2020 pandemic panic.
U.S.-based funds captured $35 billion of these flows, surpassing the entire pandemic year of 2020 when gold ETFs attracted $29 billion. September’s inflows represented the largest monthly gain in ETF history, capping the strongest quarter on record at $26 billion. Holdings across global gold ETFs reached 3,692 tonnes by August’s end, the highest monthly close since July 2022 and just 6% below the all-time record of 3,929 tonnes.
Goldman Sachs raised its December 2026 price target to $4,900 per ounce from $4,300, citing sustained ETF demand and likely central bank purchases. The bank expects Western ETF holdings to climb as the Federal Reserve cuts rates by 100 basis points through mid-2026, historically a powerful tailwind for bullion.
Central Banks Stack Gold at Unprecedented Pace
Central banks emerged as the dominant force behind gold’s ascent, accumulating over 1,000 tonnes annually since 2022, more than double the 2016-2021 average of 457 tonnes. The buying spree reflects strategic diversification away from dollar assets following Russia’s 2022 invasion of Ukraine and subsequent Western sanctions.
Key drivers behind central bank accumulation include:
- Reserve diversification away from U.S. Treasuries and dollar-denominated assets
- Protection against potential asset freezes and geopolitical sanctions
- Hedge against mounting sovereign debt concerns and fiscal instability
- Inflation protection as consumer prices remain above central bank targets
August saw net additions of 15 tonnes to global reserves, with Kazakhstan’s central bank leading purchases. Poland remained 2025’s largest buyer year-to-date, even reaffirming its commitment by raising its gold target allocation. Gold’s market value in central bank reserves has now almost certainly surpassed holdings of non-U.S. Treasuries, while overtaking the euro as the second-largest reserve asset earlier this year.
World Gold Council data shows 44% of central banks actively manage their gold reserves in 2025, up from 37% the prior year. Survey respondents cite reserve diversification, inflation protection, and geopolitical security as primary motivations.
China Steps Back as West Steps In
Chinese gold demand drove much of 2024’s 27% gain and the rally’s first four months, visible in the “Shanghai premium”, the spread between London benchmark prices and Chinese exchanges. But Chinese prices slipped below the benchmark in recent months even as gold hit new highs, signaling Western investors took over as the primary force.
The shift occurred as trade tensions escalated under President Trump’s tariff policies, roiling global markets and unleashing safe-haven buying in China through April. India’s Reserve Bank also curtailed purchases, buying just 3.8 tonnes through August compared to 45.4 tonnes during the same 2024 period.
Multiple Tailwinds Converge on Gold
The dollar’s 10% year-to-date decline made gold cheaper for international buyers while reducing opportunity costs for holding non-yielding assets. Inflation remains elevated at 2.9%, above the Federal Reserve’s 2% target, sustaining gold’s appeal as a purchasing power hedge.
Geopolitical tensions across the Middle East and Ukraine continue fueling safe-haven demand, with energy market disruptions creating inflation risks that further support bullion. The U.S. government shutdown compounded uncertainty by delaying employment reports and other data crucial for Fed decisions.
Ray Dalio advised investors at the Greenwich Economic Forum to allocate “approximately 15% of your portfolio to gold,” calling it “the one asset that performs well when the usual components of your portfolio decline”. Bank of America cautioned clients about potential “uptrend exhaustion” and consolidation near $4,000, though the warning came before gold powered through the level.
Breaking Every Record in the Book
Gold eclipsed its inflation-adjusted peak set 45 years ago when prices topped $850 in January 1980. That high came as the U.S. battled currency collapse, spiking inflation, and recession following President Carter’s freeze on Iranian assets during the hostage crisis. Analysts see faint echoes of those conditions today in Trump’s trade policies, Fed independence concerns, and persistent inflation.
he rally’s magnitude has benefited the U.S. government itself, with official holdings surpassing $1 trillion in market value last month, over 90 times what appears on federal balance sheets. This windfall dwarfs the stated book value established when the Treasury valued gold at $42.22 per ounce.
Gold Price Predictions: Wall Street’s Updated Forecasts
Major investment banks dramatically revised their gold outlooks as prices shattered previous targets. The table below shows how rapidly analyst expectations have shifted upward:
| Institution | 2025 Average Forecast | 2026 Average Forecast | Price Target | Date Updated |
| Goldman Sachs | $3,400/oz | $4,525/oz | $4,900/oz by Dec 2026 | October 7, 2025 |
| Deutsche Bank | $3,291/oz | $4,000/oz | $4,300/oz by Q4 2026 | September 17, 2025 |
| HSBC | $3,355/oz | $3,950/oz | $3,600/oz avg in 2027 | October 3, 2025 |
| J.P. Morgan | $3,675/oz by Q4 | — | $4,000/oz by Q2 2026 | August 10, 2025 |
| UBS | — | — | $4,200/oz in coming months | October 3, 2025 |
| Bank of America | $3,356/oz | $3,750/oz | — | September 15, 2025 |
| ANZ | $3,338/oz | $3,845/oz | — | September 10, 2025 |
| Commerzbank | $4,000/oz | — | $4,200/oz by end 2026 | October 7, 2025 |
| Citi Research | $3,400/oz | $3,250/oz | — | 2025 |
Goldman Sachs leads with the most aggressive forecast, projecting $4,900 by December 2026, a 23% increase from current levels. The bank expects emerging market central banks to average 80 tonnes of purchases in 2025 and 70 tonnes in 2026, contributing roughly 19 percentage points to the expected price gain.
Deutsche Bank raised its 2026 average forecast to $4,000 per ounce from $3,700, citing official demand running at double the 10-year average and recycled gold supply coming in 4% lower than expected. HSBC also lifted its 2027 forecast to $3,600 from $2,925 and introduced a 2028 forecast of $3,330.
Technical Levels Point Higher Despite Overbought Signals
According to my technical analysis, gold’s 14-day Relative Strength Index reached 78.4 in mid-April, entering overbought territory for the first time since 2020’s pandemic surge. Fibonacci retracement analysis suggests resistance near $3,250, though gold blasted through that level weeks ago. Support now sits at $3,930, $3,900, and $3,860, with resistance at $3,980, $4,020, and $4,070.
Moreover, the volume patterns show institutional rather than speculative participation, suggesting sustained momentum despite extreme readings. COMEX futures open interest declined 12% during recent price spikes, potentially signaling distribution, though ETF inflows contradict this bearish interpretation.
What’s Driving Gold Prices Higher?
Economic factors:
- Federal Reserve rate cuts totaling 100 basis points expected through mid-2026
- U.S. dollar weakness with 10% year-to-date decline against major currencies
- Persistent inflation at 2.9%, above Fed’s 2% target rate
- Mounting U.S. fiscal concerns with debt approaching $36 trillion
Geopolitical catalysts:
- Ongoing conflicts in Ukraine and Middle East fueling safe-haven demand
- U.S. government shutdown delaying economic data and policy decisions
- Trump administration tariff policies creating trade war uncertainty
- Asset seizure concerns following Western sanctions on Russia
Structural demand shifts:
- Central banks buying 1,000+ tonnes annually versus 457-tonne historical average
- Western ETF inflows totaling $64 billion year-to-date
- Dedollarization trend among emerging market central banks
- Portfolio diversification away from traditional 60/40 stock-bond allocation
Risks Remain Despite Bullish Sentiment
Goldman Sachs acknowledges risks skew to the upside “because private sector diversification into the relatively small gold market may boost ETF holdings above our rates-implied estimate”. The bank expects emerging market central banks to continue structural reserve diversification, averaging 80 tonnes in 2025 and 70 tonnes in 2026.
Potential headwinds include lasting peace in Ukraine or the Middle East, though analysts say core drivers, massive debt, reserve diversification, and dollar weakness, won’t shift soon. Better U.S. growth or Fed rate hikes due to inflation surprises could pressure gold, though market consensus leans toward continued easing.
The put/call ratio for gold options climbed to 1.4 as net long futures contracts reached 287,000 in March, suggesting sophisticated investors hedge while maintaining core positions. Retail sentiment surveys show 42% consider gold “overvalued” above $3,000, compared to 18% at $2,500, potential fuel for further upside if skeptics capitulate.
Gold ETF Holdings Surge But Room Remains
Holdings in bullion-backed exchange traded funds tell a story of renewed investor conviction. The table below shows how ETF positions have evolved:
| Period | Global Gold ETF Holdings | Monthly/Quarterly Inflow | Notable Milestone |
| Pandemic Peak (2020) | 3,929 tonnes | $29 billion annual | All-time record holdings |
| July 2022 Low | 3,200 tonnes | Outflows for 18 months | Post-pandemic selloff bottom |
| August 2025 | 3,692 tonnes | — | Highest since July 2022 |
| September 2025 | — | $17.3 billion | Largest monthly inflow ever |
| Q3 2025 | — | $26 billion | Strongest quarter on record |
| 2025 Year-to-Date | — | $64 billion | Exceeds full-year 2020 |
Holdings remain 6% below pandemic highs, suggesting substantial upside potential if buying continues. J.P. Morgan notes every 100 tonnes of net purchases by conviction buyers corresponds to a 1.7% rise in gold prices.
Ole Hansen, commodities strategist at Saxo Bank, said the move above $4,000 “reflects a deeper shift in investor psychology and global capital flows”. He added that “sanctions, asset seizures, and concerns about fiscal sustainability have nudged investors, both institutional and sovereign, toward tangible assets that sit outside the financial system”.
Gold’s performance since 1979’s similar rally suggests the bull market may have substantial room to run. Historical patterns show gold functions better as long-term inflation hedge than short-term tactical play, with correlation to inflation rising from 0.16 over five-year periods to 0.58 over twenty years.
Whether gold consolidates near $4,000 or powers toward $5,000 depends on Fed policy, geopolitical developments, and whether the structural shift away from dollar assets accelerates. What’s clear is that gold has reclaimed its position at the center of global monetary discussions after decades as an afterthought.
Gold Price Analysis, FAQ
Is gold price expected to rise or drop?
Gold is expected to continue rising based on consensus analyst forecasts. Goldman Sachs projects $4,900 by December 2026, while other major institutions including Deutsche Bank, UBS, and Commerzbank forecast targets between $4,200 and $4,300 over the same period.
What will the price of gold be in 2025?
Gold has already surpassed most 2025 forecasts by reaching $4,042 in October, well above the $3,400-$3,700 range predicted by major banks earlier this year. The current price represents a 52% gain year-to-date, making gold one of 2025’s best-performing assets. Analysts now expect gold to average between $3,800 and $4,000 for the remainder of 2025, with potential spikes above $4,100 if Fed rate cuts accelerate or geopolitical tensions intensify.
Will gold go to $5,000 an ounce?
Yes, multiple analysts believe gold will reach $5,000, though timelines vary. Goldman Sachs sees potential for $5,000 if Federal Reserve independence comes under pressure and investors shift just 1% of the $57 trillion U.S. Treasury market into gold. Ed Yardeni predicts $5,000 by end of 2026 under current conditions, calling it the “next big round number” that markets will target.
Will the price of gold go up in the next 5 years?
Long-term forecasts through 2030 show strong consensus for continued gains. Analysts project gold reaching $4,500-$5,000 by 2027-2028 in medium-term scenarios, with potential to hit $5,150-$5,800 by 2030 under optimistic conditions. Ed Yardeni’s most aggressive forecast sees $10,000 by 2030, implying 151% gains over five years, though this requires extreme scenarios including runaway inflation or severe geopolitical crises.
See:
https://www.gold.org/goldhub/research/gold-etfs-holdings-and-flows/2025/10